Making a railway coverage heatmap - Part 1
This was harder than expectedEver since i created my fast-heatmap crate (highly vectorized heatmap generator), i've been trying to find new ways of representing existing data in a cool and visually pleasing way.
I frequently go look at OpenRailwayMap, as it contains pretty up-to-date information on railway coverage, speeds, signaling and more, and a few weeks ago i had the idea of generating a world heatmap of railway coverage, to more easily see the distance between train stations.
Gathering the data
At first, i wanted to just clone the OpenRailwayMap dataset, but after a bit of looking, i didn't really manage to grab it easily, and i wanted to get started quickly, as i had lots of motivation in that very moment.
I had already initiated a project involving railways (not public yet), which is still ongoing, and it involved scraping railway APIs for various station data.
Of this data, i already had the names and coordinates of all the italian railway stations (2592), and i could begin a proof of concept with that data.
I already knew this project would be compute intensive, so i started a new rust project to get started.
The idea
Since i needed to output an image, i had to have a grid of points, each with a distance value from the nearest station. I could then use that value per each point to generate a heatmap.
I imported the geo and image crates, and got to work.
I began by creating a Vec<Point>, to store all the points on the grid, picked a starting coordinate and generated points each with a 0.0001° difference.
If you're familiar with coordinates and geographical mapping you should already be able to see an issue with that approach, but i continued on.
So i did a quick cargo run... and a few seconds later my PC started stuttering. I quickly pressed CTRL-C to try figuring out what's wrong.
The first hurdle
The obvious culprit is the Vec<Point>. After a quick calculation, i was trying to generate around 1251999000 points, which at 16 bytes per point (2 f64, latitude and longitude) amounts to around 18.6GiB of RAM. That's a problem.
This meant i could not store my data points, and they had to be generated and streamed on the fly. Sounds like a perfect job for an Iterator
Say hello to RectGridIterator! This will generate a sequence of equally distanced* points inside a rectangle.
The code was very ugly, but it worked nonetheless. I decreased the resolution for a quick test and...
Success???
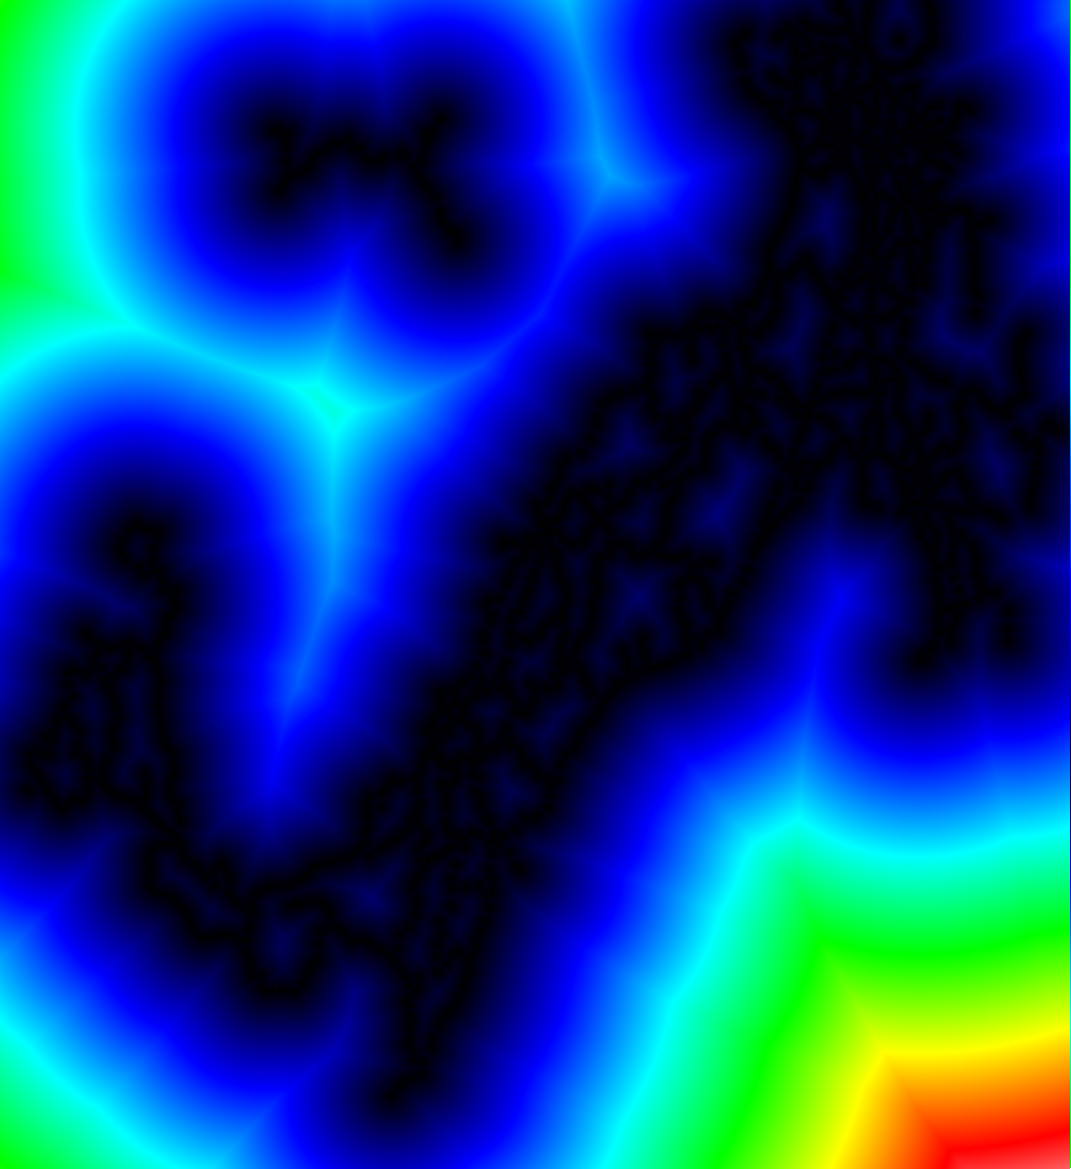
Something's clearly not right...
Changing a single line seemed to fix the scale.
let value = get_color;
All was needed was a simple subtraction.
let value = get_color;
This was very slow though, and i wanted to increase the scale. I clearly needed to improve on it.
Making it faster
There were many options to make the process faster, but the lowest hanging fruit was to utilize my whole CPU with rayon.
After quickly implementing it by cloning the iterator (around 30 bytes each, not the best), it did get faster, but a flamegraph showed that there was still a lot to be desired.
Turns out i had to completely redo my point generation algorithm to make it not suck, to eliminate all the clones.
After a bit of thinking, i managed to use the same algorithm, but generating any point at any time, without the need for a sequential order.
It sped up a LOT, even more than i predicted it would, as this cost wasn't really that visible on the flamegraph.
With this, it was time to generate a good, high resolution image. After tweaking a bit with the parameters, i got this result (scaled down, the final image is 62MiB)
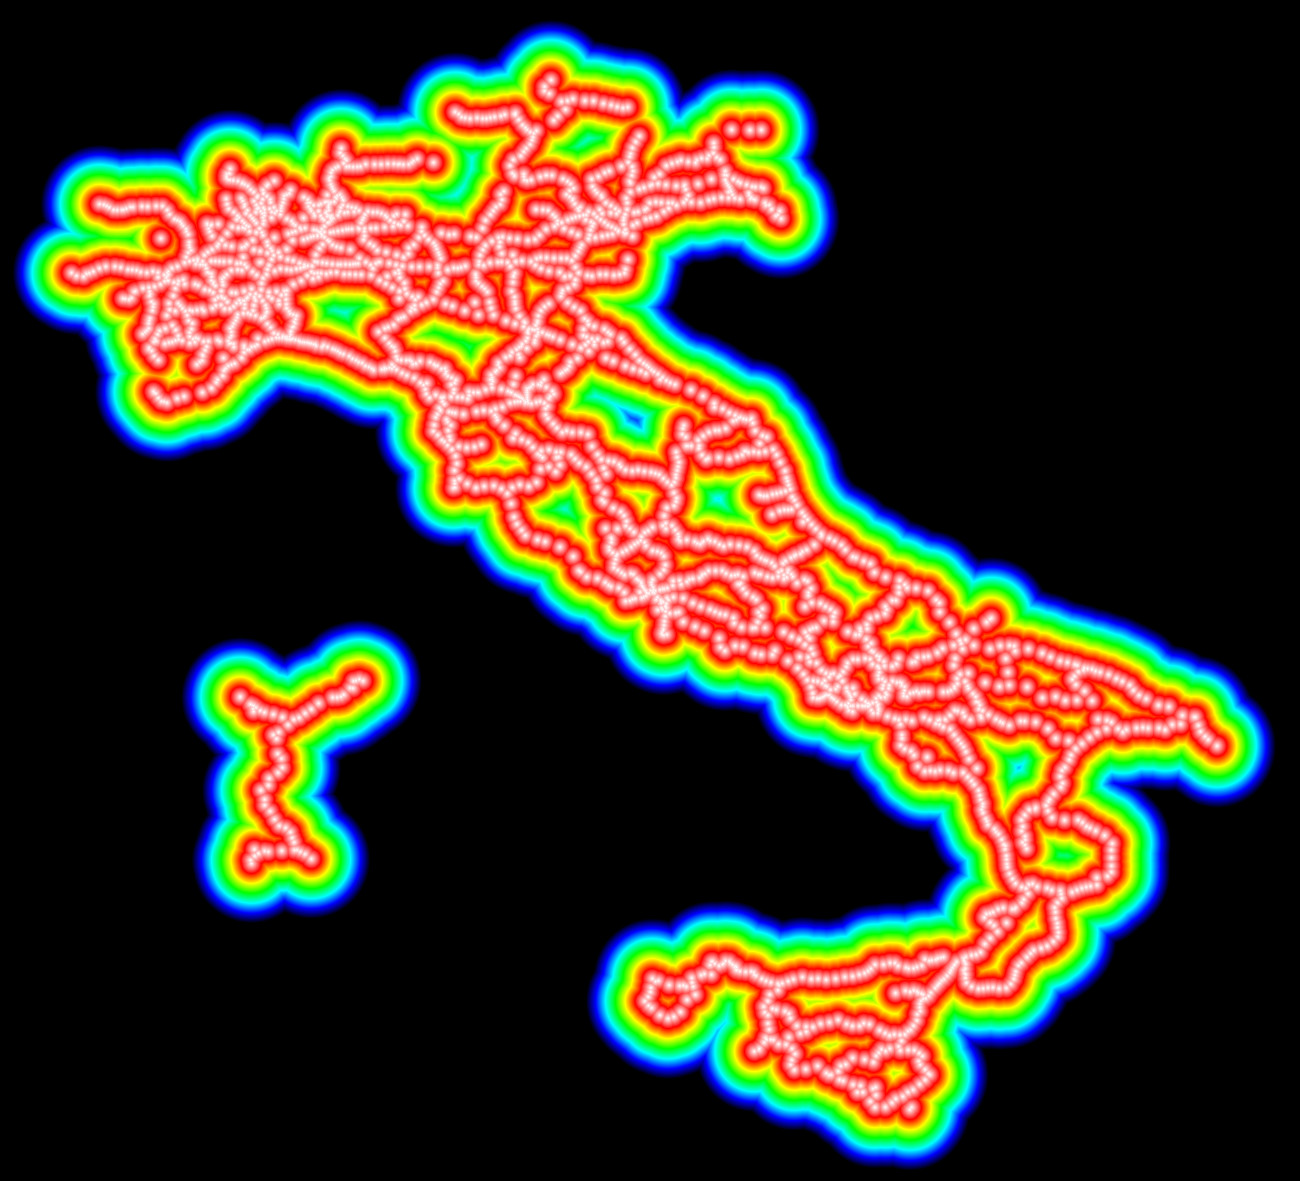
This took about 25min to generate at full resolution, which at around 1km point-to-point, wasn't too bad for a first good result.
The end?
I tried overlaying a geographical map on top of it, but i ran into some clear issues with this approach, that i hinted at earlier.
Using a constant angle does not mean a constant distance between the grid points, as this decreases the closer you are to the poles. Furthermore, i had been using the Haversine distance formula, and to generate that image, it was ran around 397 billion times. With a quick estimate, doing the whole world map this way would mean doing this calculation around 400 quadrillion (400,000,000,000,000,000) times.
That's definitely way too much and we need a better method.
In part 2, i'll try moving from a simple array to a R* tree, and switching from degrees to LAEA (constant-distance projection, in meters).
For now, you can find all the code here.
That's it for today. After all this math i'll work with something a bit more practical (hint: networking), so expect something in the coming weeks!